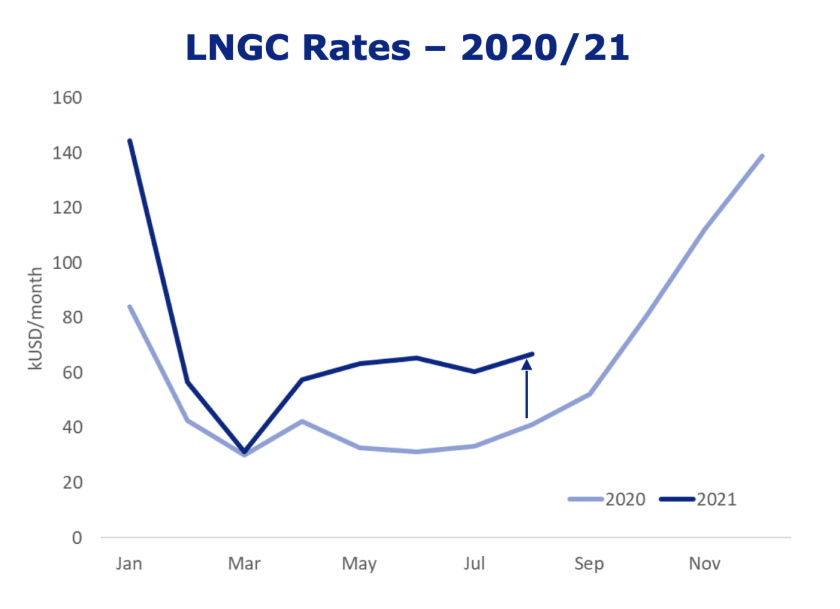
The LNG market is tightening as we speak. Earnings of vessels are significantly up compared to same period last year. Under the hood, productivity measures of the LNG fleet, such as speed and distances are also indicating increasing tightness. As indicated below, latest measurement of speed is 7% higher than last year and distances have increased 14% (see below charts).
Sources: Fearnleys and Maritime Optima.
The recent tightness in the LNG shipping markets stems mainly from increasingly tight energy markets, not only gas, but across the whole energy complex, including coal, oil and even uranium (not depicted).
Sources: World Bank and Maritime Optima
The causation for tighter LNG shipping runs along the following lines: The market expectations for 2021 was rather muted as the LNG fleet was expected to expand quite considerably. At the same time liquefaction capacity coming on stream in 2021 is at a cyclical low. Additions to liquefaction capacity is vital to demand and explains as much as 61% of the variations in volumes shipped in any given year. So, with a scenario where supply (LNG fleet growth) would probably outpace demand, market expectations were muted. However, gas prices are an important factor in the dynamics of LNG carrier demand. We observe that utilization of LNG liquefaction capacity is closely linked to gas prices, which is probably a fair assumption as gas producers will likely try to profit from better prices and increase production if possible. Including utilization of LNG liquefaction capacity in the model for volumes shipped improves explaining volumes shipped significantly. Further, we also observe that average distances travelled by the LNG vessels fluctuates with gas prices. Probably, gas is sourced first from the closest sources and then further away if need to be. Shipping is after all also a cost to the consumer.
Sources: GIIGNL, World Bank and Maritime Optima
Rough estimates of supply and demand factors 2021:
Liquefaction capacity: +2%
Gas prices: +60%
Volumes: +6%
Distances: +14%
Speed:+7%
Fleet: +8%
Demand (tonne-mile): +20%
Productive fleet growth:15%
LNG Fleet Utilization: +5%
TCE ytd: +40%
Moving forward we observe the following. There are still a considerable number of vessels to be delivered, but it is tailing off. Elderly units will probably be increasingly marginalized, but note that increased scrapping will not necessarily occur if shipping market improves significantly. Further, note that delivery of potential new orders is not likely before 2024 in any significant numbers as yards are fully booked near term.
At the same time new LNG liquefaction capacity will begin to rise from 2022, thus improving potential for demand growth. Speed of the fleet is already high. The same applies to average distances travelled. So, less impact on the market is expected from speed and distances. Therefore, on balance before gas prices are considered the odds for a tighter market balance seem to be higher going forward in 2022/2023.
The great unknown is of course gas prices. Seemingly the LNG carrier market is increasingly becoming a great play on energy prices and particularly the gas price.
Note also that Maritime Optima will soon have fully cleaned real-time AIS datasets for LNG, Bulkers, Tankers and other types of tonnage. The data will include most factors mentioned above and more.
By clicking “Accept”, you agree to the storing of cookies on your device to enhance site navigation, analyze site usage, and assist in our marketing efforts. View our Cookie Policy for more information.